‘Free aluminum’ could be costing you thousands of dollars worth of lost crop yield and quality – each year!

Daniel Hudson, UVM Extension Agronomist

  • Minerals containing aluminum are natural and abundant in the soil.
  • Acidic soils increase ‘free aluminum’ levels, which bind soluble (plant-available) phosphate, can cause plant toxicity, and ultimately can significantly reduce crop yield and quality.
  • Lime does not instantaneously correct soil pH and aluminum-related problems.  While visible improvements can be observed even in the same season, it can take years for lime to fully mitigate soil acidity and reduce levels of free aluminum.
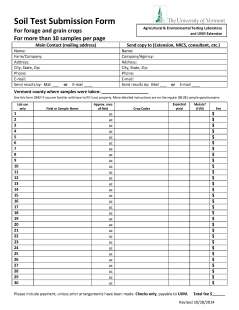
  • Soil testing every three years and following soil test recommendations will reduce the likelihood of developing aluminum-involved crop production problems.

——

Things that are invisible are not necessarily unimportant: oxygen, carbon monoxide, and gravity, to name a few. This is as true in the soil as it is above ground.  While we tend to think of soil as ‘sand, silt, and clay’,

there are many tremendously important things in it that are invisible or barely visible to the unaided eye.  This is true for much of the soil ecosystem: bacteria, viruses, massive webs of microscopic fungi, frightful soil insects, hideous mites, sprawling plant roots, decaying plant material, all sorts of [naturally occurring] chemicals.  Soil organism populations oscillate wildly, depending on environmental conditions, complex chemical reactions are occurring everywhere – it’s a war where chemical and biological weapons are the norm, and yet somehow there is order, beauty, and a little predictability to it!  And yet, most of it is invisible.

Let’s zoom in on one economically important yet underappreciated element found in soil: aluminum.  Unless someone has previously drawn your attention to soil aluminum, you may not have thought much about it before.  It sounds terribly uninteresting, doesn’t it?!  Read on only if you think crop yield, quality, and farm profitability are interesting, because aluminum is involved in all of them.

How did aluminum get in my soil?

Several years ago I had a conversation with an individual who was surprised and not a little disturbed that aluminum had somehow made its way into their soils!  It was probably a comfort to them to learn that aluminum is natural and abundant in the earth’s crust, and is not just the result of littering, government conspiracies, industrial pollution, or the Russian government.  In fact, aluminum accounts for a solid 8% of the weight of the earth’s crust, making it the third most abundant element on earth, coming in behind oxygen and silicon.

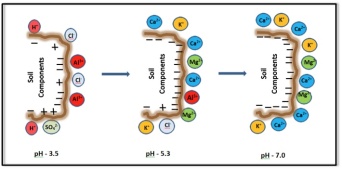
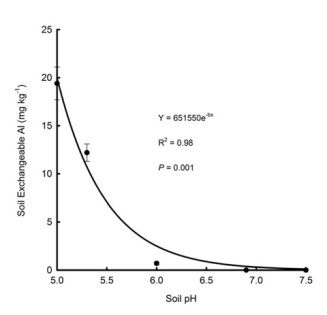
Maybe someone will find an exception someday, but as far as I know, aluminum is not an essential nutrient for any living organism.  For the most part, aluminum is a component of many stable soil minerals that are perfectly safe to handle and for plants to grow in.  Soil aluminum becomes problematic in many cropping systems when the soils are acidic (i.e., low pH).  Under acidic soil conditions, aluminum increasingly shifts from the insoluble mineral phase to soluble phases that are often referred to as ‘free aluminum’ and denoted ‘Al3+’.  Free aluminum presents several costly agronomic problems.

If free aluminum is really a problem, why have I never heard of it?

IMG_0104

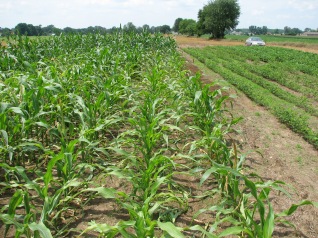
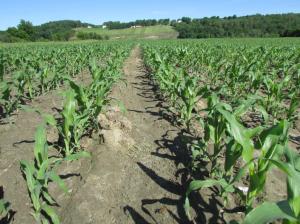
Closer corn and soy have pH –> Al-induced agronomic problems

Free aluminum is present at crop-toxic levels in 1.7 billion acres in the tropics alone, and can be implicated, at least in a secondary way, in widespread poverty, malnutrition, and starvation in those regions.  In the Northeast U.S. aluminum-involved soil fertility problems can (I estimate) result in yield losses of more than 30% when not managed appropriately.  Further losses arise from reduced forage quality.  Between lost crop yield and reduced forage quality, the total economic impact of free aluminum in the soil can easily surpass $200/ac/year in dairy cropping systems.  It is safe to say that free aluminum has caused some farms/fields to perform miserably, and even to fail.

The main reason we do not hear more about free aluminum in the soil in the U.S. is because we tend to talk more about soil pH than we do aluminum.  Soil pH has a powerful influence on soil chemistry.  Increasing acidity causes free aluminum to be much more abundant, and this causes many ‘downstream’ agronomic effects.

For the most part, the focus on pH rather than aluminum is appropriate because 1) we cannot physically remove aluminum from the soil; 2) aluminum-related problems are strongly correlated with soil pH; 3) the aluminum-related problems can be generally, over time, be mitigated by adjusting the pH; and 4) pH affects more than just aluminum ability: while all are essential plant nutrients, iron, manganese, and calcium can all cause nutrient-related problems at certain ranges of soil pH.

At a moderately low pH (4.5-6.2), the primary problems that free aluminum presents to growing crops are:

  • Binding (immobilizing) soluble phosphate, making it unavailable for crop

    uptake. As much fuss as we make about phosphorus management, in Vermont, MANY acres of Vermont crop land are severely deficient in phosphorus.  To a great extent, this problem is induced by soil acidity.  The free aluminum released as the result of soil acidity gladly and strongly binds soluble phosphate, making it unavailable for crop uptake.

  • Displacing other positively charged plant nutrients that, unlike aluminum, ARE essential. ‘Cation exchange capacity ‘ (CEC on your soil test report) is an indication of the ability of a particular soil to store positively charged atoms (ions) such as calcium (Ca2+), potassium (K+), and magnesium (Mg2+).  Think of CEC it as the ‘pantry’ of the soil.  Typical CEC levels in agricultural soils in Vermont soils range from 4 to 25

    meq/100g.  Clay and soil organic matter increase CEC, and are essentially the shelves in the pantry.  Under acidic conditions, free aluminum resolutely occupies more of the CEC positions and displaces a variable proportion of those other nutrients that would otherwise be in those positions.

Good news and bad news

Given that free aluminum is and always has been 1) abundant; 2) non-essential; 3) biologically problematic, it is not surprising that many organisms have ways to manage its presence in their environment. One of the best understood defenses plant roots have is the secretion of organic acids (such as citric and malic acids) that ‘chelate’ (i.e. bind) free aluminum.  That is the good news.

The bad news is that 1) all defenses have limits; and 2) certain plant species have better defenses against aluminum toxicity than others.  Below a pH of 4.5, the abundance of free aluminum is so overwhelming to many plant species that the normal plant defense mechanisms are often not sufficient.  In these situations, direct and indirect toxicity to plant roots and systems commonly include:

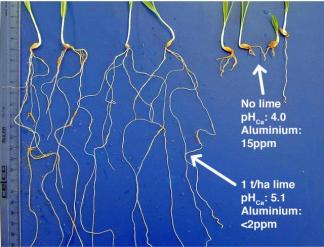
  • Stunted primary root growth by inhibiting cell division and elongation
  • Inhibition of lateral root formation.
  • Reduced root diameter, and increased root brittleness.
  • Reducing root hair development.
  • Damaged structure and disrupted  function of cell membranes.
  • More random root branching patterns.
  • Disrupted signaling/communication pathways within and among plant cells.
  • Interference with the uptake and metabolism of essential nutrients (at the molecular level, not just due to poor root development).
  • Increased susceptibility to secondary (opportunistic) diseases.
  • Not surprisingly, reduced water and nutrient uptake, and ultimately reduced crop yield.

My soil pH is 5.6, which is high enough that free aluminum toxicity should not be a problem!

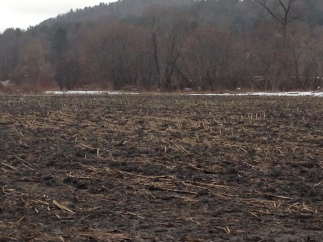
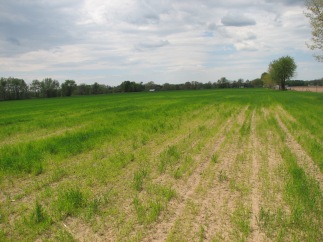
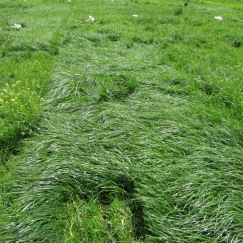
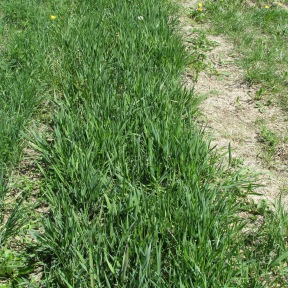
There are two things to keep in mind before concluding that your moderate acidity is not an agronomic and economic problem on your farm.  First, under such conditions, phosphorus availability is being negatively impacted by free aluminum.  While high phosphorus levels are a problem in some fields in Vermont, many of the soil test reports I see from Eastern Vermont are on the low side.  Some are extremely low.  Because there is a very strong relationship between available soil phosphate and crop yield, farmers should be alarmed when their soil test reports indicate that extractable phosphate is below the optimal level.  Secondly, if the AVERAGE soil pH is 5.6, you probably have many zones (large and small) where the pH is much lower and where aluminum-related agronomic problems are more obvious.  Some of those zones will have toxic effects on the roots – rendering the nutrients and water in those zones less available for uptake by the affected plant.  The picture to the right shows a field that IMG_9736
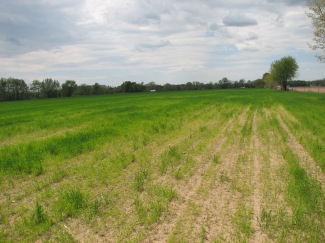
was, on average above 6.2, but the corner pictured ranged from pH 4.0 (the wheat that is almost dead) to 4.4 (the healthier looking wheat).

For many fields in the Northeast U.S., mitigating and preventing the development of severe soil acidity should be a top priority.  Unless lime is incorporated into the soil, it can take years for the lime to move into and neutralize the pH in the top several inches of soil. Thus, if you have a severe soil acidity situation and the soil conditions are well-suited for it, consider incorporating the lime to hasten the effect.

Reference material:

Delhaize, E., and P. Ryan.  Aluminum toxicity and tolerance in plants.  Plant Physiol.  (1995) 107:315-321. Online.

Dragana Krstic, Ivica Djalovic, Dragoslav Nikezic and Dragana Bjelic (2012). Aluminium in Acid Soils: Chemistry, Toxicity and Impact on Maize Plants. Food Production – Approaches, Challenges and Tasks, Prof. Anna Aladjadjiyan (Ed.), ISBN: 978-953-307-887-8, InTech.  Available online.

Harter, R. D., Acid Soils of the Tropics.  ECHO Technical Note. 2007.  Online.

University of Hawaii at Manoa. Highly weathered tropical soilsOnline

University of Hawaii at Manoa. Soil Mineralogy. Online

Panda, S.K., Baluska, F., and H. Matsumoto.  Aluminum stress signaling in plants.  in Plant Signal Behavior.  July 2009; 4(7): 592-597.

Scheffer-Basso, S., B. Prior.  Aluminum toxicity in roots of legume seedlings assessed by topological analysis.  Acta Sci., Agron. vol.37 no.1. Jan./Mar. 2015. Online.

Schulte, E.E., and K.A. Kelling.  A2520 – Soil and applied phosphorus.  Understanding Plant Nutrients. 1996. University of Wisconsin Extension. Online.

Victoria Agriculture.  Acid Soils. April 2005. Note Number: AG1182.  Online.


Posted in agriculture | Tagged , , , , , , , , , , , , , , , , , , , , , | Leave a comment

Take Time to do Your Soil Sampling Properly

Daniel Hudson, UVM Extension Agronomist

Soil sampling can feel like a lowly task, especially when you have other urgent things to do, but your crop yields and forage quality depend on you having good information.  Getting good information depends on a careful sampling process that acknowledges the fact that you are trying to get a 1 cup soil sample to accurately represent up to 40 million pounds of soil (the approximate weight of the top 6.7 inches of soil in a 20 acre field).

  1. Farmers should own the basic tools of the trade: get a good soil probe or auger.  Other tools include plastic buckets, zip lock bags, a thin spatula, and something to break soil cores apart in the bucket.  Yes, you now have another excuse to buy an ATV.
  2. Divide your crop land into ‘sampling zones.’  A sampling zone should be 20 acres or less in size, contain fairly similar soil types, and have a uniform management history.  Aside from soil types and management history, if crops in certain parts of a field tend to grow differently from the rest, that is a good indicator that you should create more than one zone in the field.  If any of the aforementioned criteria does not fit,
    Breaking up a field into sampling zones

    from University of Missouri Extension: Soil Sampling Hayfields and Row Crops http://extension.missouri.edu/p/G9217

    break the field up into more than one zone.  In some cases, it is appropriate to combine small contiguous (or extremely close) fields into one sampling zone if soil type, slopes, management history are basically the same.  In this case, total size of the zone should still not exceed 20 acres.

    • Do not take samples from places within a management zone that do not conform to the zone overall.  If most of the field has good surface drainage, do not take cores from the tiny wet area (etc.).  If the odd section of the zone is big enough to justify it, you can take a separate sample for that area.  Otherwise just avoid it.
  3. Establish a system for keeping track of which samples came from which zone/field. 
  4. Using a zig-zag or grid pattern, collect 15-20 soil cores from within each sampling zone.  For standard soil testing of corn and forage fields, cores should be taken from the top 6 to 8 inches of the soil.  Place the cores in the plastic bucket as they are collected.
    • If you are sampling a corn field where fertilizer was band-applied and/or fields where manure was injected, follow the guidance given here.
    • If manure was spread or deposited recently, do not probe through the manure.  Move the probe over to a nearby place that is not covered with manure. [Ideally, soil sampling will be done prior to late-summer or fall application.]
    • If there is a lot of living or dead plant material on the surface, gently scuff it aside with your boot or the tip of the probe, taking care not to displace actual soil.
    • If green grass, rock, or thatch is obvious in the sample, remove it prior to sub-sampling.  Don’t obsess about pebbles.
    • It is probably better to rely on the soil laboratory to screen out plant roots in the early stages of sample preparation.
  5. After 15-20 cores from a zone have been collected in a bucket, the cores
    soil-sampling_2005_044_zoom

    These soil core fragments need to be broken up more prior to sub-sampling. Picture from OMAFRA: http://www.omafra.gov.on.ca

    should be broken up (using a trowel, spatula, etc). Mix as completely as possible.

    • Wet soils or soils with layers of clay will often be more challenging and may need to be air dried and crushed before thorough mixing is possible. To air dry samples, spread them out in a thin layer in trays lined with paper.  Applying a fan will hasten the process, but do not apply heat.
  6. Obtain a representative sub-sample from the sample collected.  Depending on the diameter of your soil probe and the depth of your sample, you could have between 2 and 4 cups of soil from a management zone from which you need to take a 1 cup sub-sample to submit to the lab.  Develop a procedure to get a truly representative sub-sample from the entire sample from that zone.
  7. The process I often use to get a representative sub-sample is as follows:
    • LABEL THE BAGS you are using to submit the samples: date, your name, field name. Imagine getting all the work done and realizing that some or all of the bags are not labeled!  The Field Name should be a short but recognizable version of what you call the field on an every day basis.  Labeling the sample “Field 1” just because you sampled it first is not a good idea...
    • Dump the thoroughly mixed/crushed soil in a pile on a flat, clean, and washable (or disposable) surface.
    • Divide the pile of soil into 4 – 8 pie-shaped wedges.
    • Take two opposite wedges – entirely, and put them in the appropriate labeled bag.
      • A thin, unslotted kitchen-type spatula is a good tool for dividing and collecting the wedges.  Attempting to use just your hands can result in a skewed result as finer soil particles will stay on the surface or fall between your fingers.
    • If you need a little more soil to attain the volume you need to send to the lab, take some soil from the other wedges using a similar approach. Field_crop_multiform_ 10_28_2014_Page_1
  8. Put the sub-sample in the appropriately labeled plastic bag.
    • Fill out the paperwork, and submit the samples to the lab. Don’t forget to include the “crop code.” If you are a Vermont farmer who hopes to get a state-approved nutrient management plan, BE SURE the lab you choose uses the “Modified Morgan extraction procedure.”
  9. Send the bagged samples/sub-samples to the soil analysis laboratory as quickly as possible.  For a complete list of certified soil labs, click here.  If there is going to be ANY delay in sending it to the lab, refrigerate (but do not freeze) the sample.  Soil is ‘alive’ and chemically reacting, so the longer you delay submitting your soil sample, the lower your data quality from the sample will be.
    • Air-drying the soil samples is an extra step, but it is an even better alternative to refrigeration if your goal is to slow the deterioration of soil sample quality. Air drying should be done at room-temperature (no heat).  Spreading the samples out on clean paper and applying a fan will hasten the drying process. In this case, ‘air drying’ means that it needs to get ‘dry-as-dust,’ with no sign of moisture.VT_Nutrient_Rec_Field_Crops_1390-cover_Page_01
  10. Interpret and follow soil test report recommendations.  Most land-grant universities have publications designed to help with this.  Here in Vermont, we use Nutrient Recommendations for Field Crops in Vermont.  You should print a copy of this type of document and familiarize yourself with:
    • Ideal soil status for your crop with respect to: pH, phosphate, potash, magnesium, sulfur, boron, and other micro-nutrients.
    • Nutrient removal rates and management guidelines for various crop.
    • Nutrient sources and management guidelines for those practices.
    • Other crop-specific information for geographic area.

Local Extension agronomists and certified crop advisors are equipped and ready to help you interpret your soil test report and to make practical recommendations.

Posted in agriculture, Uncategorized | Tagged , , , , , , , , , , | Leave a comment

“Is Soil Sampling in the Spring as Good as Soil Sampling in the Fall?”

Daniel Hudson, UVM Extension Agronomist

IMG_1645

NEK VT corn stubble in early-April

While routine soil sampling in the fall is preferable, spring soil samples can still provide practical guidance for the upcoming cropping season.  As the parent material (originated from rock) and organic matter in the soil weathers and decomposes, plant-available nutrients are released.  These chemical and biological processes typically result in a peak concentration of plant-available nutrients in the spring/summer.  Concentrations of plant-available nutrients will vary during the year and be driven by: soil texture, crop uptake, soil temperature, soil moisture, precipitation/leaching, soil pH, biological activity, compaction, soil organic matter, crop history, manure history, and other management factors.

IMG_1651

NEK VT Hay Field/Pasture in April

Soil sampling at the end of the growing season is preferable, but spring sampling can still be helpful

Long-term, it better to collect your soil samples in the fall after corn harvest or after your last cut of perennial forages, but prior to manure application.  This should give you the best view of your baseline level of plant-available nutrients and help you understand the ideal approach to soil fertility management on each field next spring, or each spring until your next soil test is due.

It is similar to assessing your firewood inventory after you stoke your wood stove for the last time in the spring.  You may have a bunch of wood left, it could be mostly gone, or you may have run out in March.  That information is obviously useful for making plans.

IMG_1650

‘I think we might make it.  Better get more next year, though.’

The difference is that your plant-available nutrients in the soil are generally lowest at the end of the cropping season, and thus the recommendation to test at that time.  If a particular nutrient was critically low after harvest last September, it will probably be critically low at certain points in the coming growing season unless improvements are made to the nutrient management process.

If you don’t have current soil samples for your fields, DO take samples this spring, but plan to move toward establishing a late-season soil testing program in the near future.

Posted in Uncategorized | Leave a comment

Probing for Essential Information

PSNT2

Daniel Hudson, UVM Extension Agronomist

Have you ever felt like you should check some health metric, but didn’t want to face the possibility that the news might not be favorable?  If my cholesterol is high, they are going to put me on a vegetarian diet!  Sometimes, it is just better not to know.  What I don’t know can’t hurt me!IMG_9736

In the realm of cropping systems, it goes more like this:  If I soil test this field, I’m afraid the report will 1) tell me that I need to spend $200/ac to fix my soil fertility problem, and 2) confirm that my brother was right – that we have been losing massive amounts of yield and quality that could have been prevented.  I’d rather not know!!

While ignorance is bliss, it is also expensive.  The cost of soil testing in terms of time and lab fees is a pittance compared to annual reductions in crop yield (often over 30%) and forage quality that result from nutrient deficiencies.   A soil testing regimen will inform you of the status quo as well as the direction the soil fertility is headed in a given field.  Soil fertility has implications for crop yield/inventory, forage quality, plans for spreading manure, the value of land you might rent, legal compliance, and more.  Every professional farmer should own and use a soil probe or auger.Lynd_7a

The fertilizer guy has someone soil test for me – for free!  Why would I get my own probe?’  Whoever you delegate the task to, if anyone, you need to be confident that they have your best interests in mind and that they are competent.  Even if it is your best friend doing your soil sampling, you should still own a good probe so that you can check up on things once in a while.  Aside from being essential for routine soil testing, soil probes are also helpful for efficiently diagnosing in-season agronomic problems when they arise, such as, ‘why does the grass grow so well over here, but looks terrible over there?’

What kind of probe should I get?

A wide array of soil testing equipment available online – I do not recall ever seeing a ‘real’ soil probe in a store.   When considering the options, note that:

  • Short probes are less expensive, but require much more bending. This is okay for a few samples, but after a whole day of sampling you might reconsider your frugality.
  • Thin-walled probes are less expensive and light to carry around, but can often kink and break when the soil is hard and in rocky fields.
  • Some probes have replaceable tips.
  • Some soil probes open along the middle, which allows for easier extraction of the cores, especially with certain soil types and soil conditions. I don’t have one of these, but I like the concept.
  • Having a step on the side of the probe can make it easier on your wrists and elbows but, if the probe is flimsy to begin with, this type will probably break more quickly.
  • Some probes are designed with a longer side-cut-out that allows you to take (and remove) 12 inch (or deeper) soil cores. This is necessary for pre-sidedress nitrate testing (PSNT).
  • You can even mount a slide hammer on some soil probes on the market! This is good for dry soil without rocks.  If you have rocks, the slide hammer will ensure that your soil probe (at least the tip) will be destroyed in short-order.

Like everything these days, there are lots of options.  I have not even covered soil augers, which some prefer.  As with most things, you get what you pay for.

By listing these online sources of soil probes, augers, and other soil testing equipment below, I am not implying any sort of endorsement of one over another.  There are, no doubt, many other great sources of this equipment online that I have not listed below.  If you are in a pinch and need a soil probe before yours will arrive, most Extension offices that house an agronomist can lend them out.  You can also check with your local Conservation District or NRCS office.

An incomplete list of online sources of soil testing equipment:

M&M Supply Company

Grainger

Gemplers

JMC Soil Samplers

Ben Meadows

AMS


Posted in Uncategorized | Tagged , , , , , , , , , , , | Leave a comment

The Upside of Poor Spring Weather in Vermont?

The extra few days of lousy field conditions may actually serve to help some to get a few necessary things in order. Here are a few things that are new this year that all farmers should understand while there is still time to implement the practices:

  • The vast majority of professional dairy farmers in Vermont are now legally required to soil test every three years.  This applies to “certified small farm operations,” MFOs, LFOs, and maybe even UFOs.
  • The farms mentioned above are also legally required to test each the manure from each storage source at least once every year.  It is better to take spring and fall samples from each storage source if you are able.
  • Both of these arise from the VT-RAP requirement (6.03.a) that these types of farms follow the Vermont-specific USDA-590 standard on nutrient management planning.
  • These farms will be periodically be inspected by the state, so it is not just and “accepted practice,” it is required and will be enforced.
  • Part of executing your required nutrient management plan is record-keeping.  Among other things, be sure to keep good records of how much manure went in which field, at what rate, when it went on, what the conditions were, etc (this is not a comprehensive list of the records you are required to keep).

These very practical (and legal) realities about soil and manure testing that arise from the Vermont Required Agriculture Practices (RAPs) issued from the legislature last year, and are part of the overall requirement to have a nutrient management plan.  The five bullet-points above are not an exhaustive representation of the law, so be sure to familiarize yourself with it by clicking on the link.

If you are having trouble discerning how this law this applies to you, please contact me, another UVM Extension agronomist., or better yet, Ryan Patch (VT Agency of Agriculture).  Please understand that we (UVM) are just messengers – we did not write the law. That being the case, we are glad to help you understand and comply with it.

Posted in Uncategorized | Leave a comment

Video: Reed canary grass seeded with and without a companion crop

Dairy producers are seldom ambivalent about reed canary grass as a forage species on their farm — they either love it or hate it.  Those who hate it generally have had difficulty getting it harvested at an acceptable level of maturity, and the fiber levels end up being higher than they prefer.  Others like to grow it because of its productivity, persistence, winter-hardiness, and its ability to thrive in a range of soil types and conditions.

conklin-17a

reed canary grass one year after a spring seeding

‘Feral’ varieties of reed canary grass (such as are common in roadside ditches) are high in bitter-tasting compounds called alkaloids, which can reduce dry matter intake and reduce performance in grazing species.  Plant breeders have been successful in breeding low-alkaloid varieties of reed canary grass (such as Palaton, Marathon, Chiefton, and probably others – no endorsement implied) that are palatable enough to even be used in dairy grazing systems.

A few years ago I asked a local farmer if he had ever planted reed canary grass.  He said, “Yes – I – did!  The seed was wicked expensive, and I never saw so much as a stalk of it come up!”  This points to one of the challenges with reed canary grass: low seedling vigor, and low yields in the first year.

To be fair, reed canary grass seedlings are different – not deficient.  In order for reed canary grass to gain a foothold, very few seedlings need to survive.  It ‘knows’ that it has rhizomes and that they are a tremendous strategic asset, so it focuses on underground development more than top-growth in years 1 and 2. Good for the plant, bad for the feed inventory!  If a farmer is not careful with seed placement and/or attentive to managing competition appropriately in year-1, it is certainly possible that the stand will be a failure.

But what if the farmer cannot afford to accept the low first-year yields?  Will companion crops such as spring triticale, oats/peas, clover, or Italian ryegrass help significantly?  Yes, they can, but there is a balance that could be hard for some to find.  We want decent yield in the seeding year, but we also don’t want to out-compete the perennial species (reed canary grass, in this case) to the extent that we damage second year yields or lose the stand altogether.  That is the subject of the short video below. Footage was collected in Spring of 2016.

Posted in Uncategorized | Leave a comment

Is This Corn Really Sulfur Deficient?

by Daniel Hudson, UVM Extension Agronomist

A farmer called several weeks ago and said that his corn was looking ‘striped.’ The interveinal chlorosisagronomic jargon for this condition is ‘interveinal chlorosis.’ Indeed, it was faintly, yet distinctly exhibiting those symptoms.
His theory was that it was sulfur or magnesium deficiency, which was a very reasonable starting point. Most farmers are somewhat familiar with various nutrient deficiency symptoms in corn:

  • Purple corn on cool soils usually indicates phosphorus deficiency (which is often temporary)
  • Yellowing and tissue death on leaf margins, beginning with lower leaves? Potassium deficiency!
  • Generally yellow and spindly plants; yellowing of leaves starting at the bottom and moving upward with time; yellowing begins along midrib and moves outward toward the margins; lower leaves and previously yellow tissue often in various stages of death: nitrogen deficiency!
nitrogen deficiency in corn

symptoms of nitrogen deficiency

In this field, however, the lower leaves were deep green, and the upper leaves tended to be more  striped. Looking at an individual plant, the symptoms were similar to sulfur deficiency, but basically every plant in the field had the same symptoms — there were no patches where the corn looked ‘normal.’

Ordinarily, I would expect a sulfur deficiency to be on sandy soil and to be patchy/localized.  Because manure application is never perfect, the corn in areas where manure was applied more heavily are much less likely to have the symptoms. However, nobody had seen/noticed a sulfur deficiency on this field before, it receives manure (a good source of sulfur) and the soils were warm (which often increases sulfur availability and IMG_2696results in sulfur deficiency symptoms disappearing). Together these things were pointing to hybrid (genetics) interacting with environmental effects without a clear connection to a particular nutrient deficiency.

When in doubt, taking a tissue test can reveal the nutrient deficiency that is responsible for the deficiency. Ideally, a separate composite sample will also be collected from asymptomatic plants in the same field and of the same variety, but in this case there were no asymptomatic plants. Given the stage of maturity, rather than collecting whole plants or ear leaves, we collected 20 youngest fully developed leaves from around the field. The leaves were submitted to Cumberland Valley Analytical Laboratory via the feed company. The analysis showed that while boron, manganese, and magnesium were on the lower range of the sufficiency range, the symptoms were not consistent with deficiencies of any of those nutrients. Sulfur (the primary suspect) concentration was toward the middle of the sufficiency range, and the mild interveinal chlorosisN:S was about 14:1, which is not problematic. One caveat I will add is that there is an interesting theory floating around that with the yield potential of modern corn hybrids, the ‘sufficiency range’ should be indexed to yield potential, i.e., the sufficiency range for corn grown in a context where it is headed for 17 tons/acre will be different from corn at the same developmental stage that is headed for 30 tons/acre. That said, published sufficiency ranges might not be nuanced enough and may need refining.

The aforementioned farmer had the same hybrid planted in another field located 30 minutes from the home farm, and the plants in that field exhibited the same symptoms.  At this point everything is pointing toward variety X environmental effects. Since then, I have seen a couple of other farms with similar symptoms in their fields.

Internet searches will reveal various articles discussing plants with symptoms discussed above.   Richard Taylor (University of Delaware) has observed the phenomenon in Delaware and Greg Binford (Wilbur-Ellis, formerly at University of Delaware) apparently have observed similar things in the Midwest. While they lean toward a sulfur-involved hypothesis, they believe that there is a varietal aspect, yet acknowledging that grain yields from fields with ‘symptoms’ can still exceed 300 bushels/acre (which is phenomenal). At the same time, intuitively, yellow stripes suggest less chlorophyll, which makes one wonder about less photosynthesis and compromised yield.

What to do?? Take a look at your fields and let me know if you see these symptoms in any of your fields. If you do, please let me know which varieties are exhibiting the symptoms. Maybe we can find a pattern and better understand what is going on, whether it is a concern, and how to deal with it. Contact: daniel.hudson@uvm.edu mobile: 802-535-7922.

Posted in agriculture, Uncategorized | Tagged , , , , | Leave a comment

Alfalfa and tall fescue: what you should expect from them and what they expect from you

A refresher on profitable management of alfalfa and tall fescue.  Click the picture to go to the article located at the Progressive Forage website.

alfalfa and tall fescue pfg


Posted in Uncategorized | Leave a comment

What do you know about meadow fescue?

Here is an article that I recently wrote for Progressive Forage on the subject of meadow fescue — a grass that deserves serious consideration by those interested in forage quality.  Click on the picture below to go to the article.


pfg meadow fescue pic

Posted in Uncategorized | Leave a comment

Unlocking Your Corn Sidedress-Nitrogen Recommendation

There is a certain precise amount of nitrogen that your corn crop will need this year in order to achieve its yield potential.  The problem is that nobody knows what it is.  Another problem is that nobody can afford to guess.  Money is too tight to just throw extra nitrogen on the field, and inventory is too important to go the route of allowing your sidedress rate correlate with the milk price.  The good news is that there are good tools for figuring out what your sidedress rate should be!

Adapt-N and the PSNT are useful tools for predicting sidedress nitrogen needs for corn.  IMG_1390

While Adapt-N is a great tool, you need to have a certain set of data to make it work.  The good news is that if you have a current nutrient management plan, you have most of the information you need already!

In order to make the process of transferring that information from the farmer to the program (or the consulting agronomist), I have created a couple of forms that have all or most of the data necessary to make Adapt-N work.  The PDF version of the form will work for those just interested in hand-writing the information.  The Excel version of the form will be more useful for someone with multiple fields or fields with zones where the treatment is similar from one field or zone to another.  For example, if fields 1,2, and 3 all had the same manure rates, hybrids, and planting dates, you could enter all the data that is the same for all of the fields, and then save the document under three different names, and finally enter the correct unique information into each of the respective documents.

The PSNT is a good-old standby that works most of the time.  The problem is that it does not know that we have had a cool spring and that a lot of the nitrogen in the pipeline (i.e., soil organic matter) has not mineralized at the same rate it would have if temperatures were warmer.  It does not know about our weather patterns.  That said, the PSNT will generate a recommendation that is better than blindly guessing.  Keep in mind that the PSNT should be taken only when the corn is 6-12″ tall and that the PSNT is not useful if broadcast applications of nitrogen have already been applied.  Be sure to avoid taking samples near the zone where starter fertilizer was placed.

See also:

Cornell PSNT Fact Sheet

2016 Cropping Season Addendum to Nutrient Recommendations for Field Crops in Vermont

Posted in Uncategorized | Leave a comment